Profile
>
Post by Uzeyir
Uzeyir Ktk

Uzeyir Ktk

Google Certified Data Analyst

Peshawar, Peshāwar District

Uzeyir Ktk

7 months ago

Google Capstone Project

🚴 GOOGLE CAPSTONE PROJECT: Uncovering Cyclistic's Rider Insights! πŸ“Š

I'm thrilled to share the latest update on my recent project, where I delved into the fascinating world of Cyclistic, Chicago's bike-sharing program. πŸŒ†

Cyclistic, founded in 2016, has grown significantly, boasting a fleet of more than 5,800 bikes and 600 docking stations. What makes Cyclistic unique is its commitment to inclusivity, offering a range of bikes, including reclining bikes, hand tricycles, and cargo bikes, to cater to a diverse group of riders, including those with disabilities. 🌟

For this project, I set out to answer a pivotal business question: "How do annual members and casual riders use Cyclistic bikes differently?" πŸ€”

My journey began with data analysis, using Python to clean and merge various CSV files into a comprehensive dataset. This formed the backbone of my analysis. 🐍

The real magic, however, happened when I visualized the data using Tableau. The result? A detailed final report that sheds light on the distinctive ways Cyclistic members and casual riders interact with our bikes. πŸ“ˆ

Cyclistic offers flexible pricing plans, including single-ride passes, full-day passes, and annual memberships, each offering a unique experience to riders. πŸš€

I'm excited to share my findings, which provide valuable insights into how different rider groups engage with Cyclistic's services. This project has been a fantastic opportunity to explore the world of data analysis and its practical applications. πŸš΄β€β™‚οΈ

If you're interested in learning more about this project or the fascinating world of bike-sharing data analysis, feel free to reach out! 🌐

#DataAnalysis #CyclisticProject #UrbanMobility #Tableau #Inclusivity #datavisualization #datainsights #vizoftheday #makeovermonday #Python #Googlecapstoneproject #Googledataanalytics #dataanalytics #datascience
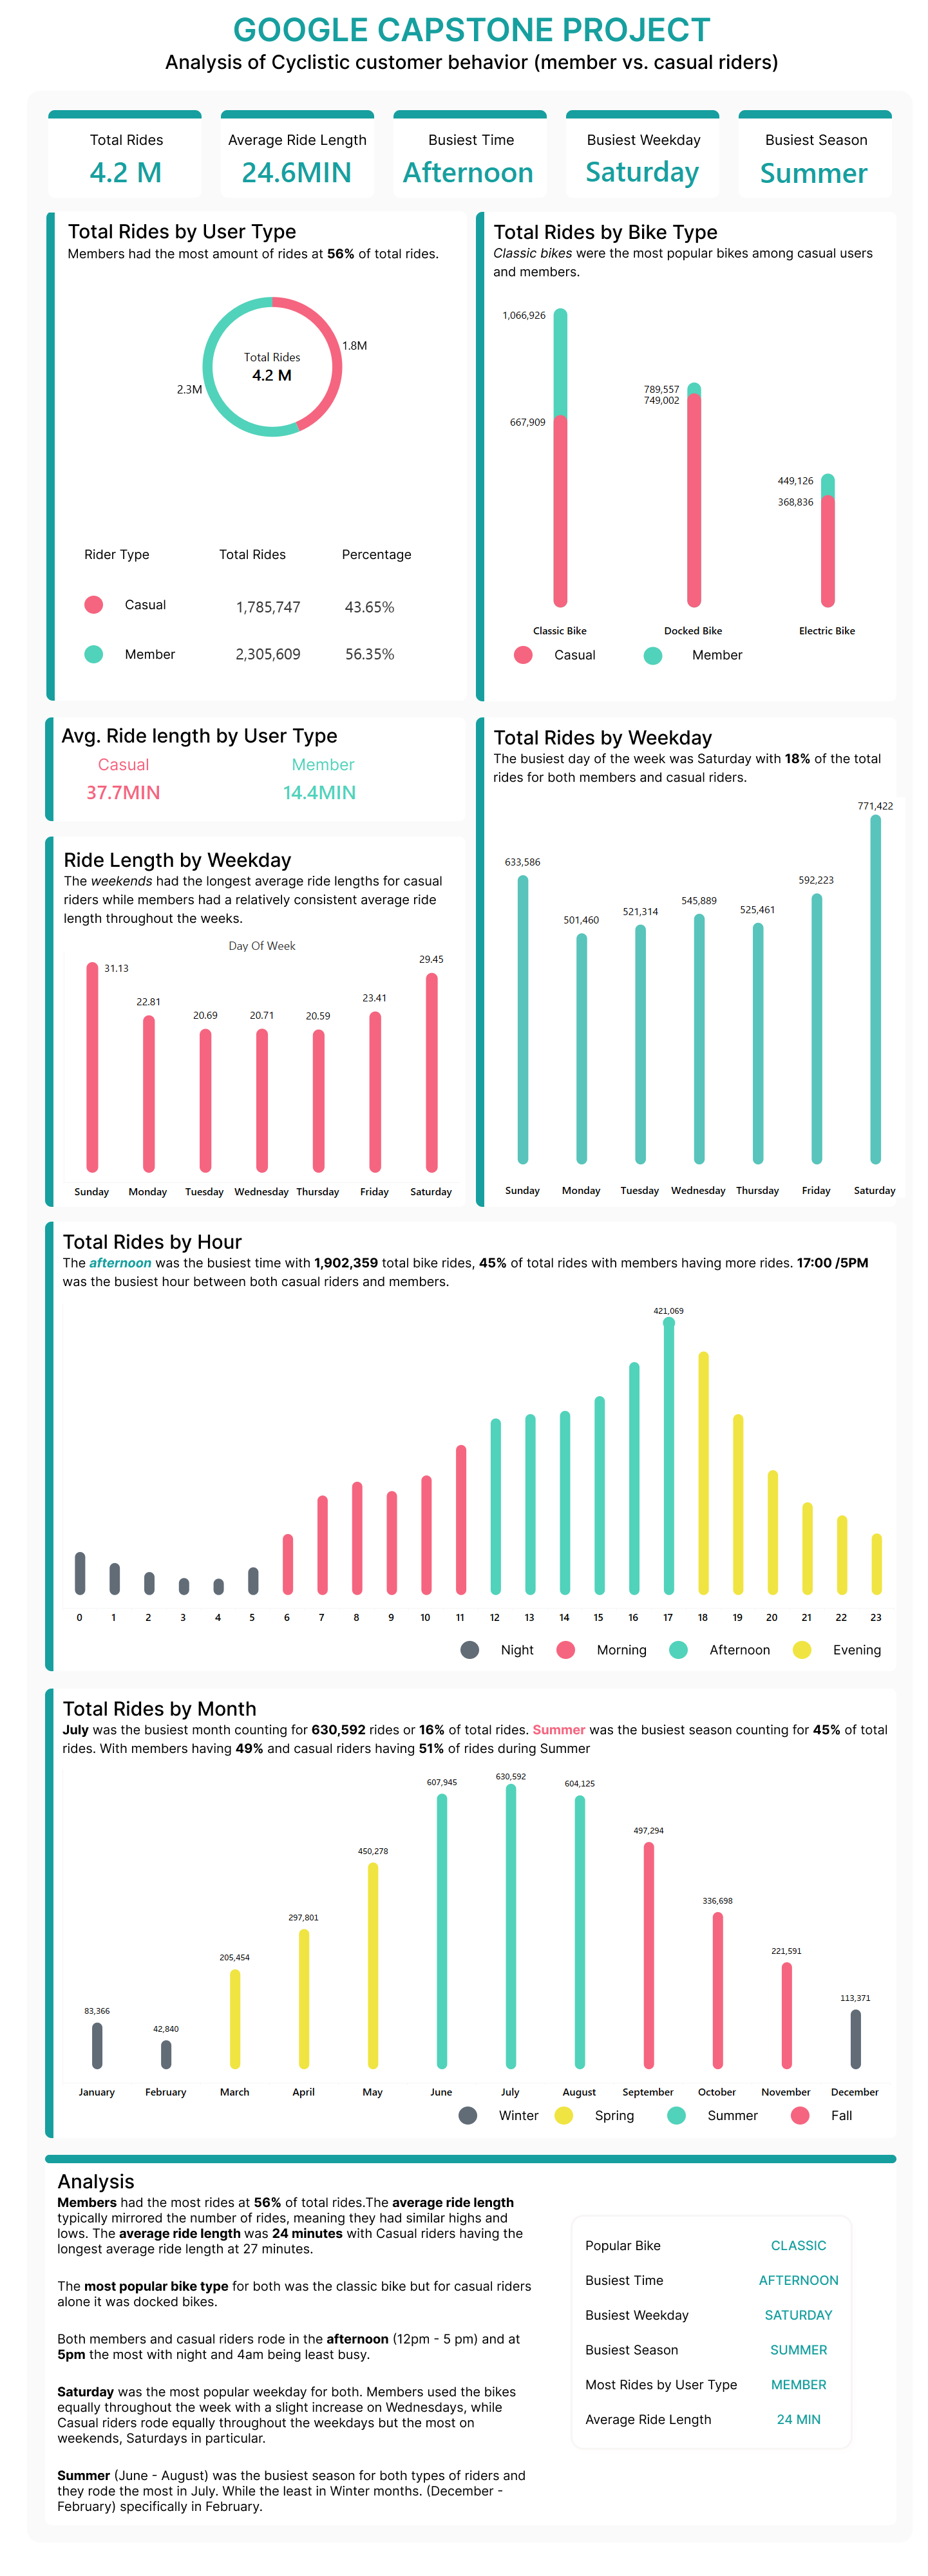
GOOGLE CAPSTONE PROJECT

Analysis of Cyclistic customer behavior (member vs. casual riders)


Total Rides

42M

Average Ride Length

24.6MIN

Total Rides by User Type

Members had the most amount of rides at 56% of total rides.

18M
23M
Rider Type Total Rides Percentage
® casual 1,785,747 43.65%
® Memoer 2,305,609 56.35%
Avg. Ride length by User Type

Casual Member

37.7MIN 14.4MIN

Ride Length by Weekday

The weekends had the longest average ride lengths for casual
riders while members had a relatively consistent average ride
length throughout the weeks.

Day Of Week
aah
3113
2281 2141
| 2060 son 20% |
Sunday Monday Tuesday Wednesday Thursday Friday Saturday

Total Rides by Hour


Busiest Time

Afternoon


Busiest Season

Summer

Busiest Weekday

Saturday

Total Rides by Bike Type

Classic bikes were the most popular bikes among casual users

and members.

Docked Bike

1.066.926

789.557
749.002


449.16

628%

Classic Bike Electric Bike

Casual Member

Total Rides by Weekday
The busiest day of the week was Saturday with 18% of the total
rides for both members and casual riders.

11422
613.586
592.023
HAH BBG
»21.314 h7h.46
501,460
Sunday Monday Tuesday Wednesday Thursday friday Saturday

The afternoon was the busiest ime with 1,902,359 total bike rides, 45% of total rides with members having more rides. 17:00 /SPM

was the busiest hour between both casual nders and members

0 1 2 3 4 5 6 7 8 9 10 1" 2 3 woos 16 1” © 19

Total Rides by Month

421.069

20 2 2 2

Night ® Morning ®

Afternoon Evening

July was the busiest month counting for 630,592 rides or 16% of total rides. Summer was the busiest season counting for 45% of total
rides. With members having 49% and casual nders having 51% of rides during Summer


LL [er
a7 94 60414
497754
asarrm
130.600
7780:
pn nn
ni
ars
[ 42.840
January February March April May June July August September October November December
® Winter Spring ® Summer ® Fall
Analysis
Members had the most rides at 56% of total rides. The average ride length
typically mirrored the number of rides, meaning they had similar highs and
lows. The average ride length was 24 minutes with Casual riders having the
longest average ride length at 27 minutes. Popular Bike CLASSIC
The most popular bike type for both was the classic bike but for casual riders Busiest Time AFTERNOON
alone it was docked bikes.
Busiest Weekday SATURDAY
Both members and casual riders rode in the afternoon (12pm - 5 pm) and at
5pm the most with night and 4am being least busy Busiest Season SUMMER
Saturday was the most popular weekday for both. Members used the bikes Most Rides by User Type MEMBER
equally throughout the week with a slight increase on Wednesdays, while
Casual riders rode equally throughout the weekdays but the most on Average Ride Length 24 MIN

weekends, Saturdays in particular.

Summer (June - August) was the busiest season for both types of riders and
they rede the most in July. While the least in Winter months. (December -

February) specifically in February.
Β 

0 likes Β· 0 comments

Science and Technology

Do you want to manage your own group?

orange logo